A bewildering variety of eruptive and ejective phenomena continually take place in the solar atmosphere on a wide range of space and time scales. Such events can cause a large disruption of the atmosphere, lead to an enormous release of magnetic energy, launch impulsive mass ejections, bring about the reconfiguration of the magnetic domain structure, and even have an impact on Earth. Among those phenomena, there is one whose understanding has progressed very slowly: surges. Surges are chromospheric ejections mainly seen as blue and redshifted absorptions in Halpha (see Figure 1) with line-of-sight velocities of tens of kilometers per second and lengths of 10 – 50 Mm, reaching, in extreme cases, 200 km/s and 100 – 200 Mm, respectively. Surges have also been detected in other chromospheric lines such as the Ca II 8542 infrared triplet, Mg II h&k, He I 10830, H 4861, as well as in Ca II H & K (see Liu & Kurokawa 2004, Nishizuka et al. 2008, Vargas et al. 2014, Kim et al. 2015, among others).
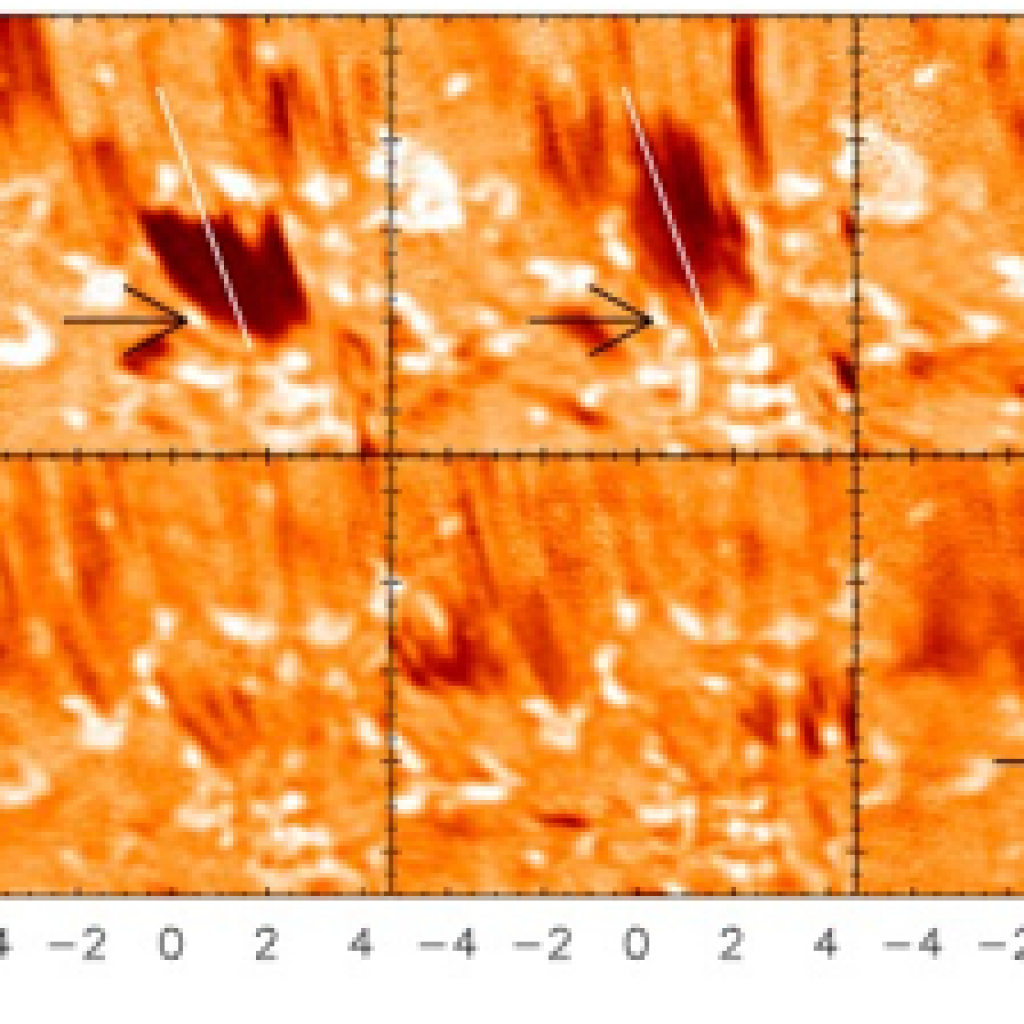
Figure 1. Temporal evolution of a surge observed by IBIS (Nelson & Doyle 2013) in the blue wing of the Halpha line profile (top) and in the red wing (bottom). The black arrow indicates the location of an EUV brightening associated with the surge.
Why are surges important? From a general point of view, the origin of surges is in the chromosphere: a complex solar atmospheric layer that hosts drastic transitions such as from fully ionized to partially ionized regimes, from LTE to non-LTE radiative transfer, from high plasma- to low plasma- , among others (see Carlsson et al. 2019). Therefore, surges constitute an ideal laboratory to get key insights into processes like nonequilibrium and partial ionization, which are also relevant in other astrophysical scenarios. From a more particular solar perspective, one of the most striking features of surges is their frequent and close relationship to multitude of different solar atmosphere phenomena, namely, Ellerman bombs (e.g., Watanabe et al. 2011, Vissers et al. 2013), ultraviolet (UV) bursts (see Rouppe van der Voort et al. 2017, Nóbrega-Siverio et al. 2017), light bridges (Asai et al. 2001, Robustini et al. 2016, Bai et al. 2019), explosive events (Madjarska et al. 2009), UV, extreme-UV or X-ray jets (Canfield et al. 1996, Chen et al. 2008, Joshi et al. 2020, among others), flares (Huang et al. 2014, Schrijver & Higgins 2015), and eruptive filaments (Li et al. 2017). In fact, surges are able to trigger Coronal Mass Ejections (CMEs) by disrupting the adjacent magnetic field during their launch (Zheng et al. 2013). Furthermore, surges are commonly associated with one of the most fundamental processes in the Sun: magnetic flux emergence (Brooks et al. 2007, Guglielmino et al. 2010, Guglielmino et al. 2018, Ortiz et al. 2020).
Unravelling the physical nature of surges is however an outstanding and challenging problem in solar physics. There have been observational reports about surges since the late 1930s (McMath & Pettit 1937), but it was in the 1990s when the first magnetohydrodynamics (MHD) numerical models appeared. Yokoyama & Shibata 1995 showed through 2.5D MHD experiments that surges could be ejected next to hot jets as a result of magnetic flux emergence from the interior. Almost two more decades had to pass to see the first 3D MHD numerical experiment in which a cool and dense wall (resembling a surge) was obtained also as a by-product of magnetic flux emergence and reconnection (Moreno-Insertis & Galgsaard 2013), but not fully explored due to the lack of radiative transfer and other entropy sources necessary to properly treat the chromospheric plasma. The aforementioned models provide the basis to explain the simultaneous ejection of surges and jets/flares; nonetheless, they can be only considered as first steps since they are extremely idealized. Only recently, radiation has been included together with optically thin losses and thermal conduction in the 2.5D modelling of this phenomenon (Nóbrega-Siverio et al. 2016), showing that the surge is strongly affected by efficient heating/cooling mechanisms to the point that a significant fraction of the surge (Figure 2) could not be captured in previous papers due to the lack of those mechanisms. These results shed light on some of the fundamental thermodynamical properties of these cool ejections; nevertheless, neither 3D radiation-MHD studies nor exploration of nonequilibrium and partial ionization, which are known to be crucially important in the chromosphere and flux emergence processes (Leenaarts et al. 2011, Nóbrega-Siverio et al. 2020a), have been performed on surges so far. It is now that the combination of the major development of computational capabilities with the implementation of more efficient numerical methods (Nóbrega-Siverio et al. 2020b) has made feasible the three-dimensional computations of nonequilibrium and partial ionization effects together. In addition to the theoretical/numerical difficulties, very limited development has been made in terms of comparisons between simulations and observations. For instance, Nishizuka et al. 2008 found resemblances between a modeled surge and an observed one in Ca II H broadband filter images taken by Hinode/SOT; however, that identification was carried out through morphological image comparisons, instead of using forward modeling. More recently, synthetic observables were obtained for surges (Nóbrega-Siverio et al. 2017, 2018), but only focusing on the transition region Si IV and O IV lines and not in the common chromospheric lines in which they are observed. Only Hansteen et al. 2019 have shown synthetic chromospheric images of a surge; nevertheless, the focus was on UV bursts, laying aside the analysis of the cool and dense ejection. These examples illustrate the imperative need of direct comparisons between simulations and observations employing forward modeling. Furthermore, even though surges have been observed in various chromospheric lines (as mentioned above), these lines are formed in non-LTE conditions and depend on complex radiative transfer effects such as partial frequency redistribution and 3D scattering (e.g., Leenaarts et al. 2012) that need to be taken into account to interpret and properly derive constraints from observations. As a consequence, we also lack inverted models from the corresponding spectral profiles to compare with the results from numerical experiments.
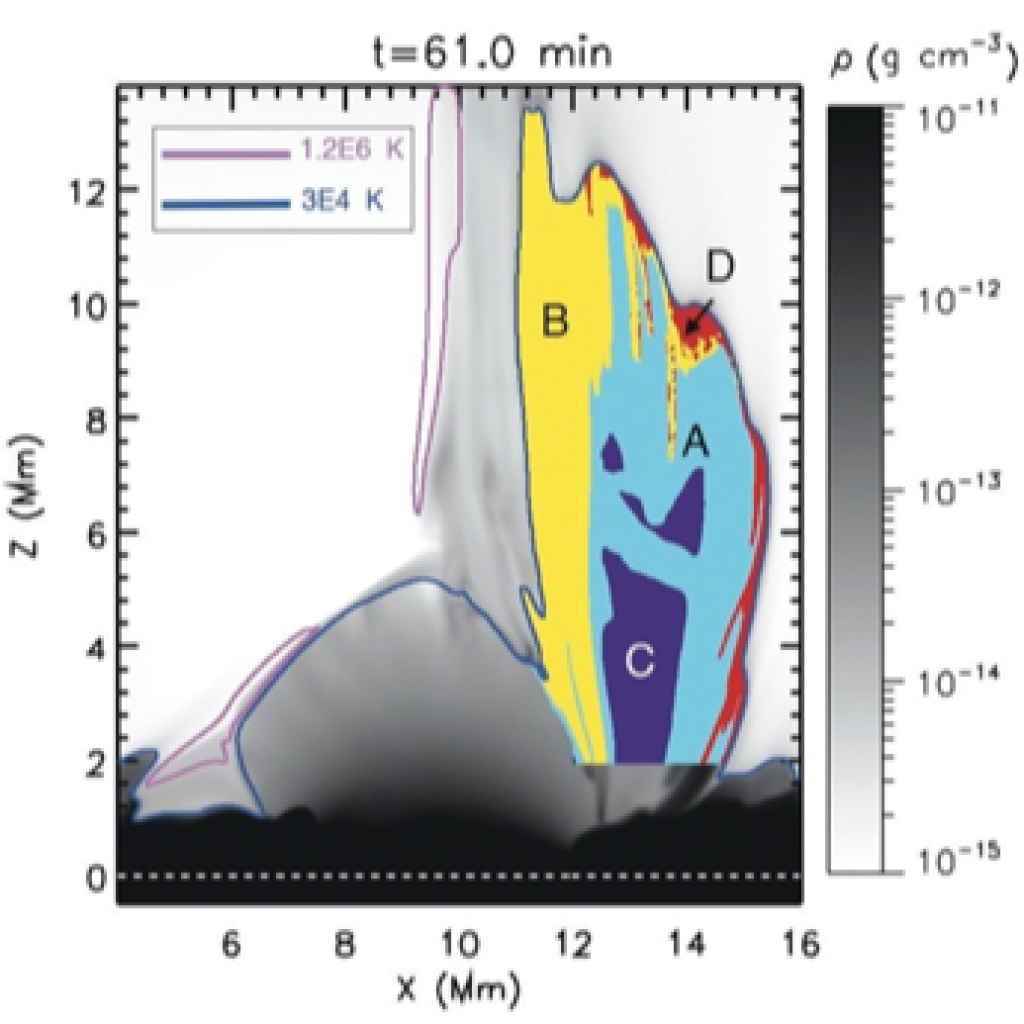
Figure 2. Density map from the paper by Nóbrega-Siverio et al. 2016 showing the four plasma populations within the surge related to the different role of the heating/cooling mechanisms. Populations B and D cannot be obtained in idealized experiments.