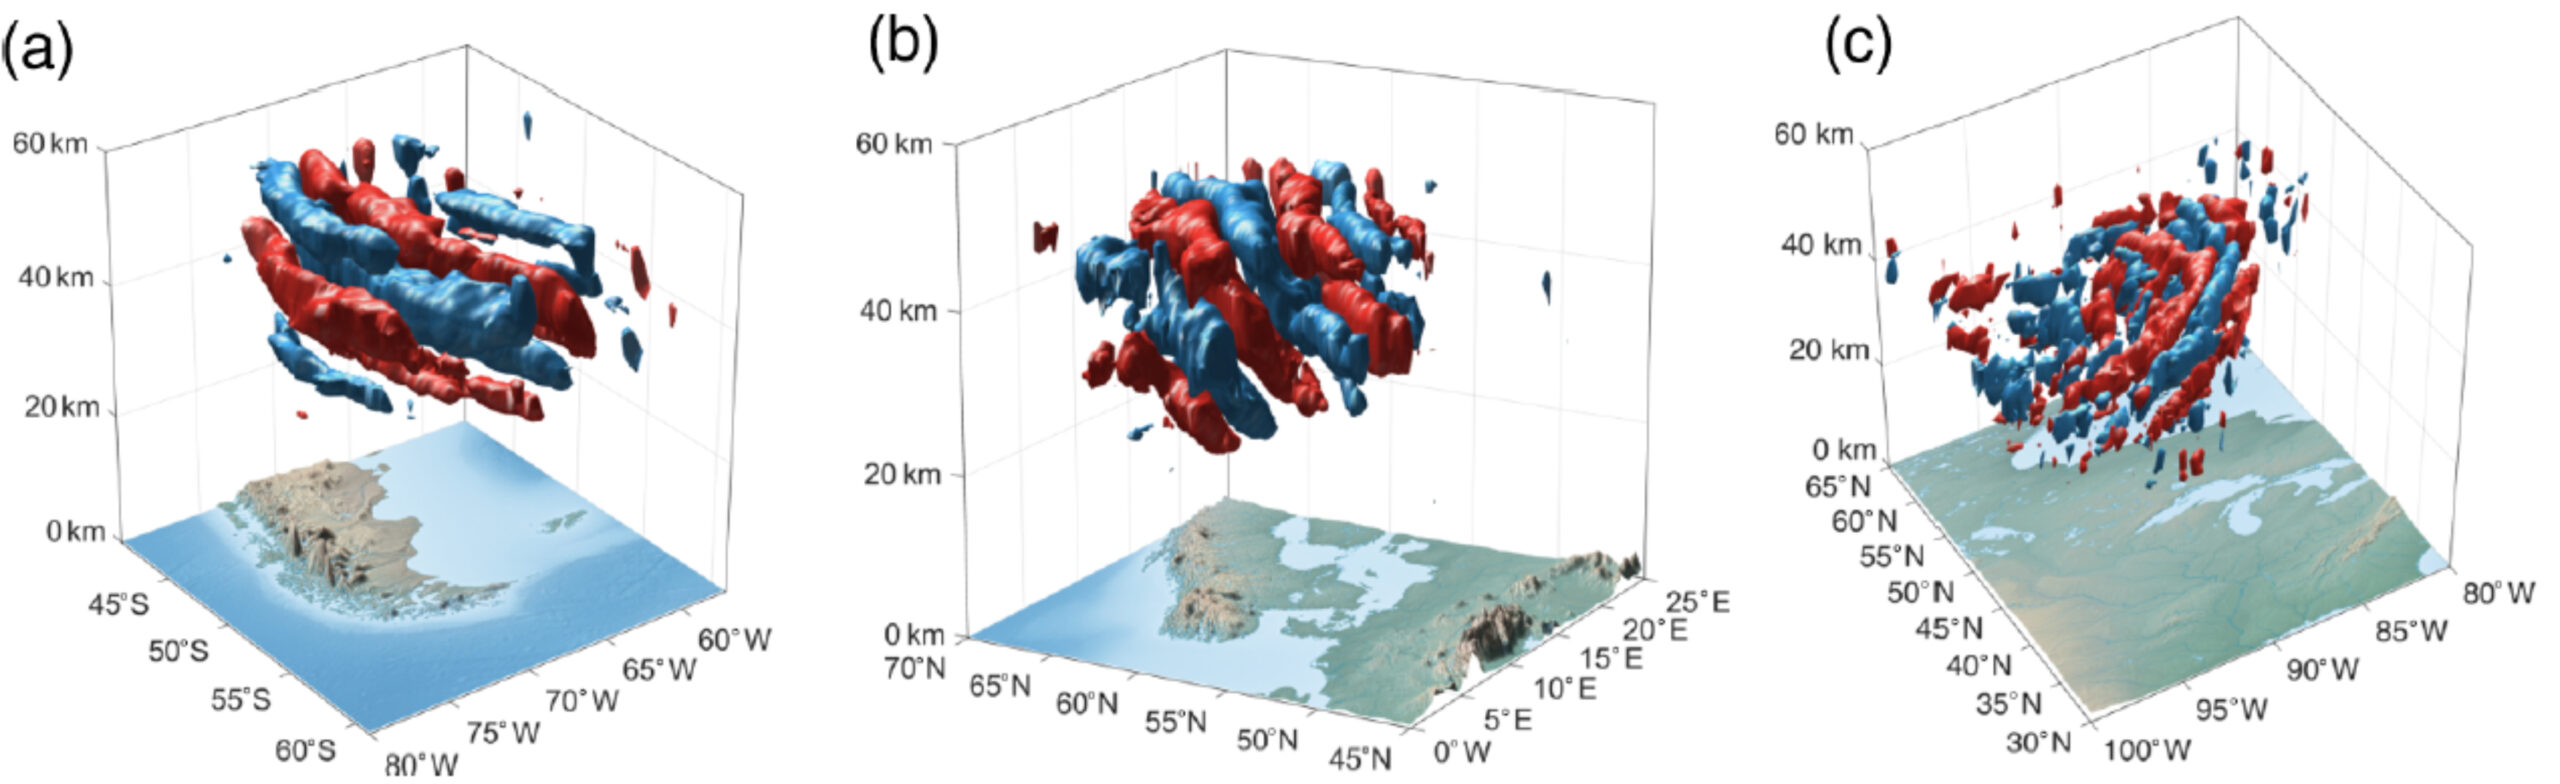
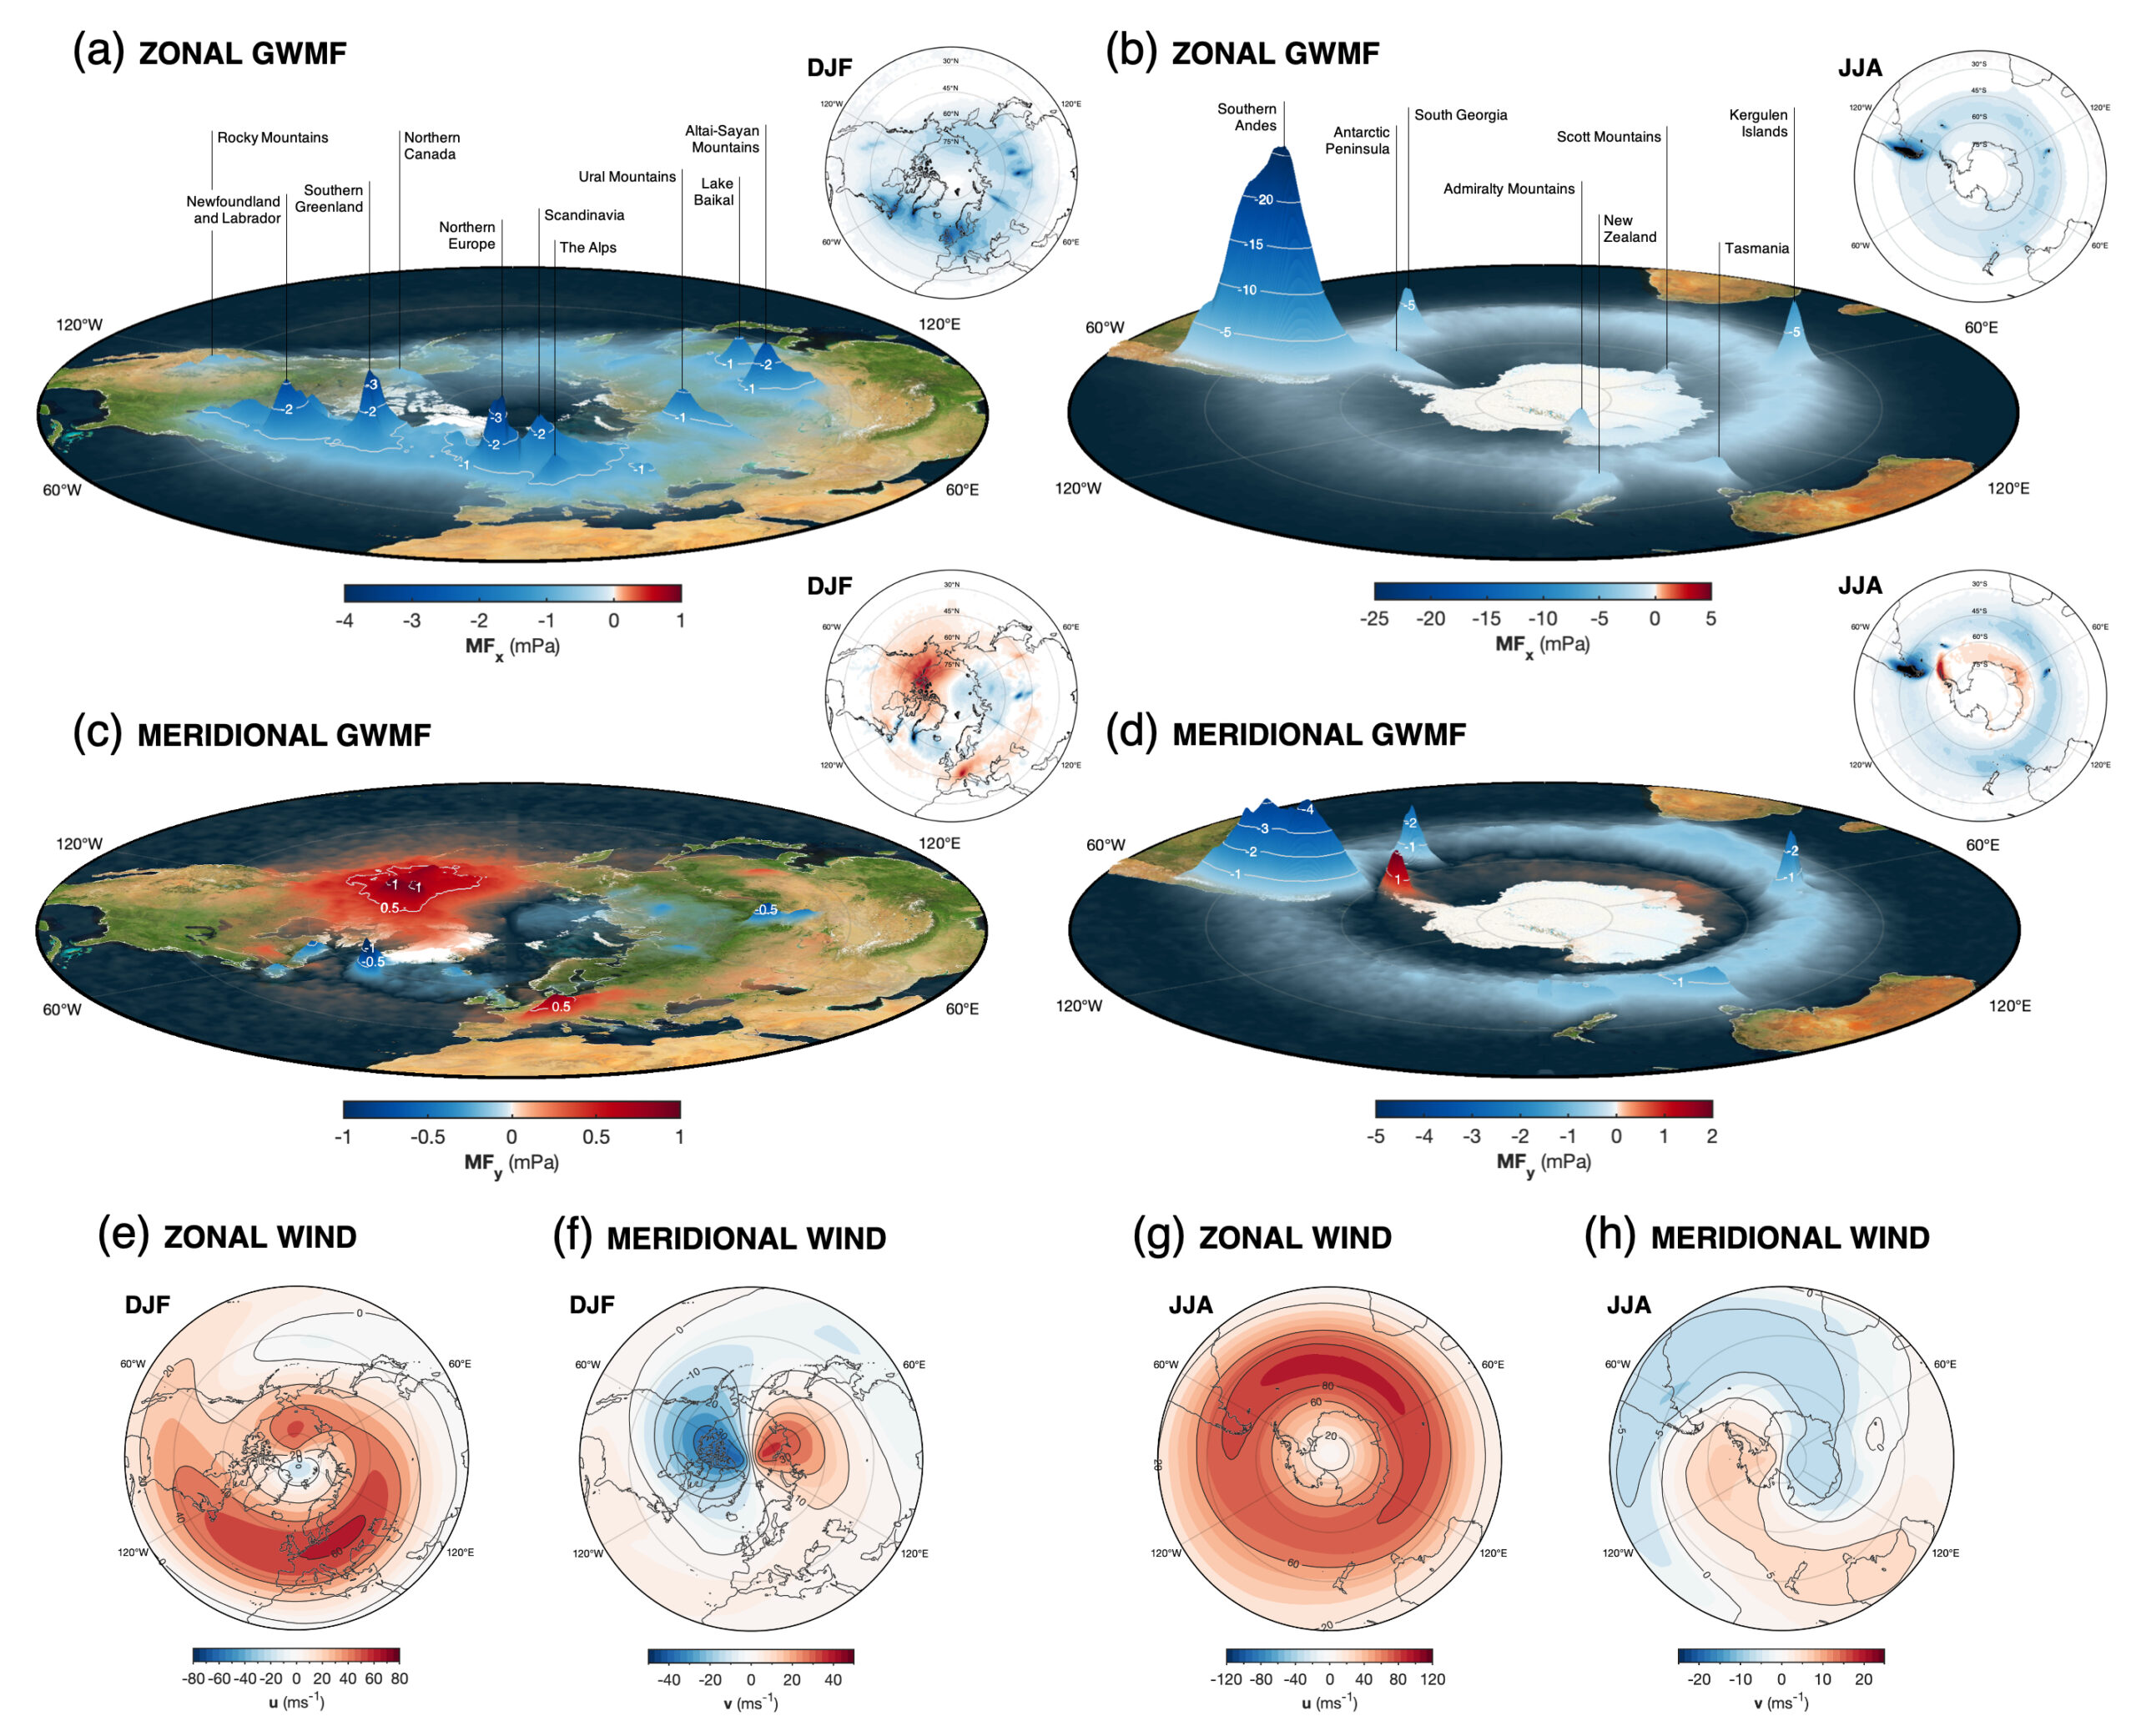
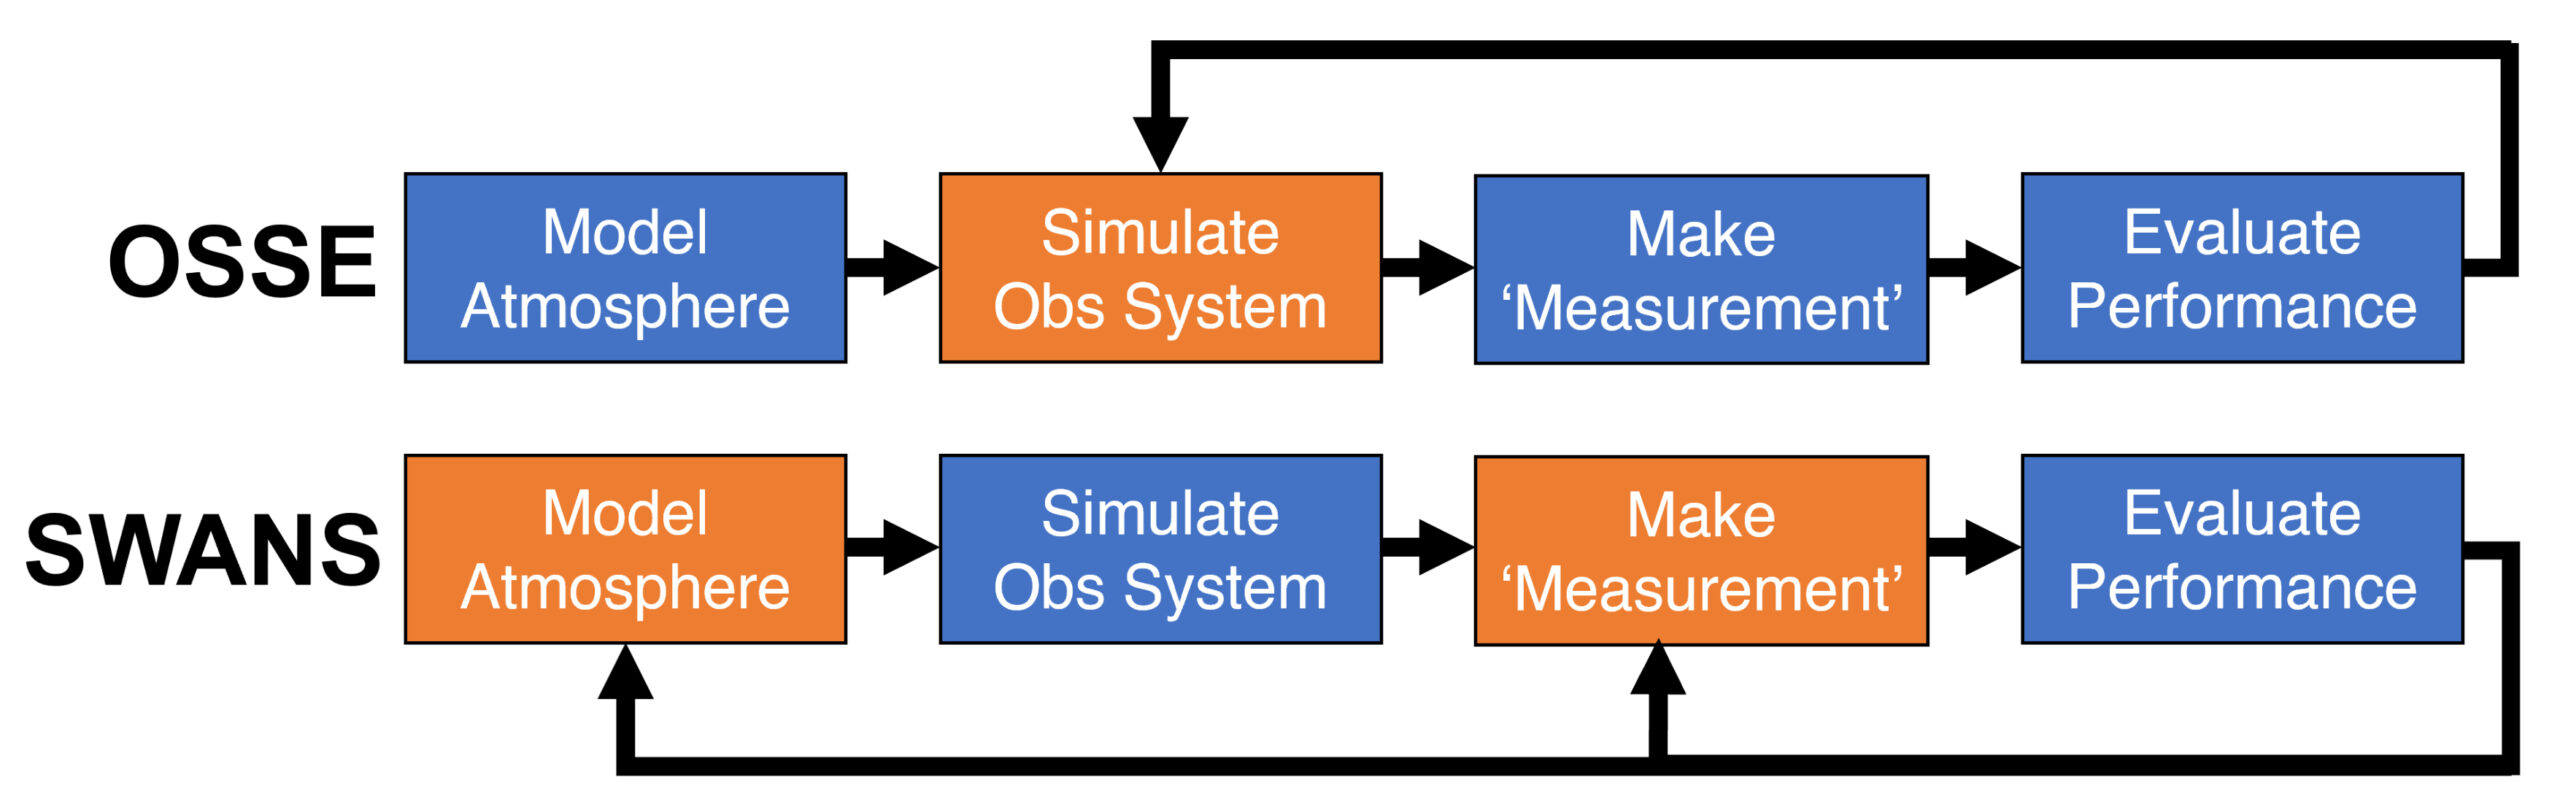
Figure 1: Gravity waves in data from NASA’s AIRS instrument, observed over (a) the Andes mountains, (b) Scandinavia and (c) a large convective storm in North America. Reproduced from Wright et al. (2021).Figure 2: GW momentum flux estimates derived from NASA’s AIRS instrument, in the (top row) eastward (bottom row) northward direction, for (left) boreal (right) austral winter. Reproduced from Hindley et al. (2020).Figure 3: Schematic showing the approach we will take in SWANS. The upper row shows the operational flow for a satellite-design OSSE: a fixed model atmosphere is sampled using the proposed system, then the extracted data is processed, the results evaluated, and the observing system modified. In our project, we will instead assume a fixed observing system and modify the model and processing chain to better reproduce real GW observations. For each row, orange boxes indicate elements that are modified and blue elements that stay constant.