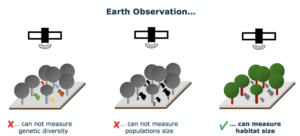
Species genetic diversity is a critical aspect of ecosystem health, but assessing it can be challenging due to the complexity of gathering and analyzing relevant data across large spatial scales. Traditional methods often require extensive fieldwork and labor-intensive sampling for DNA sequencing, which limits the frequency and scale of genetic diversity assessments. The Genes From Space monitoring tool uses Earth Observations (EO) to track habitat changes over time and infer population trends as indicators of genetic diversity.
Leveraging public EO data, the tool enables users to calculate two genetic diversity indicators adopted by the Convention on Biological Diversity:
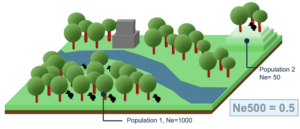
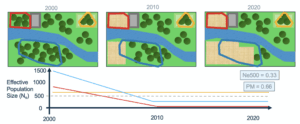
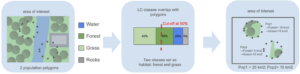
1. The Ne > 500 indicator, indicating the fraction of populations with an effective population size (Ne) above 500 units. Populations with Ne below 500 units are at risk of genetic erosion. Ne > 500 a headline indicator in the GBF.
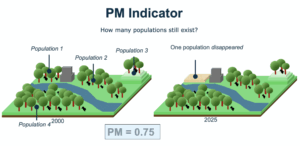
2. The Populations Maintained indicator (PM), indicating the fraction of populations that are maintained (i.e., did not go extinct) over time. This is a complementary indicator in the GBF.
Developed within the BON in a box platform, the tool provides an interface that simplifies the process of selecting EO datasets, running analyses, and interpreting genetic diversity indicators. Ultimately, this tool offers a more scalable and accessible solution for researchers, conservationists, and policymakers to monitor and protect biodiversity at local, regional, and global levels.
How does the tool work
The tool process requires two main inputs:
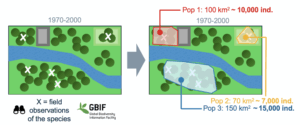
1. Population polygons. These spatial polygons define the location and extent of species populations, including their effective size. Polygons can be provided directly by the user or generated from point coordinates of observed occurrences—either uploaded by the user or retrieved from the Global Biodiversity Information Facility (GBIF). When population size is unknown, it can be estimated programmatically based on the habitat area of each population.
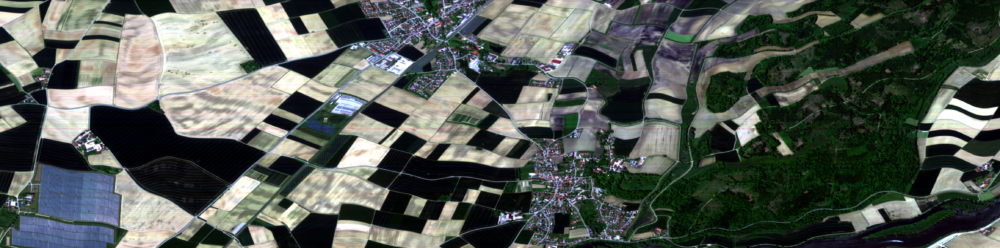
2. Habitat change over time. These inputs are maps describing temporal changes in suitable habitat for the species. They are derived from Earth Observation datasets, such as the European Space Agency’s global land cover maps or tree cover data from the Global Forest Watch. By quantifying changes in habitat area for each population over time, the tool estimates potential changes in population size and calculates the Ne500 and PM indicators accordingly.
The processing steps used by the Genes from Space monitoring tool are implemented as BON in a Box scripts and pipelines. These steps include:
- Obtaining GBIF observations: The user specifies a species of interest, an area of interest, and a time period. The tool then retrieves the corresponding species occurrence records from the Global Biodiversity Information Facility (GBIF).
- Getting habitat maps: The user specifies the area of interest, the time periods of interest, and the preferred land-cover dataset to evaluate habitat change (e.g., global land cover or tree cover maps). The tool then automatically downloads the corresponding maps from open-access Earth Observation data sources.
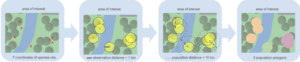
- Identifying suitable habitats: The user provides the population polygons together with a land-cover map of the study area. The tool analyzes the land-cover composition within each population polygon to identify the predominant classes and suggests which ones are most relevant for defining suitable habitat. It then calculates the area of suitable habitat for each population.
- Calculating genetic diversity indicators: Based on temporal changes in suitable habitat area across populations, the tool estimates corresponding changes in population size for each population. These estimates are then used to compute the genetic diversity indicators Ne500 (proportion of populations above the effective population size threshold of 500) and PM (proportion of populations maintaining stable size over time).
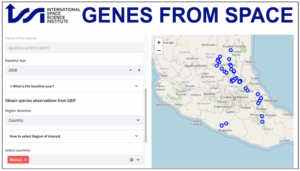
An interactive interface
The Genes from Space monitoring tool will be accessible through an intuitive, interactive web interface. The will guide users in preparing the required input data via interactive maps and visual elements, and allow users to explore the resulting genetic diversity indicator predictions dynamically through the same interface. The beta version of the interactive tool is available at https://www.gfstool.com/.