In our first meeting, we outlined the problem – Jupiter’s non-auroral ionosphere is complex and contained what was an array of unexplained features. Firstly, the altitudinal electron densities, measured using both in-situ spacecraft measurements and radio occultations, have consistently shown highly complex morphologies, with both small-scale and larger bulk changes in ionospheric density, sometimes at much lower and higher altitudes than the predicted peak (Coffin et al. 2025, https://doi.org/10.1029/2025JA033754; Tiranti et al. 2025, https://doi.org/10.1029/2025JA034066). Secondly, across the disk, images of the ionospheric brightness revealed complex regions of brighter and darker emission. Only one of these features had a clear explanation, the dark magnetic equator was thought to be an equatorial ionospheric fountain (or perhaps ‘gutter’) where neutrals winds move across, i.e. perpendicular to, magnetic field lines, forcing ions to rise into the surrounding magnetosphere (or sink into the underlying stratosphere).
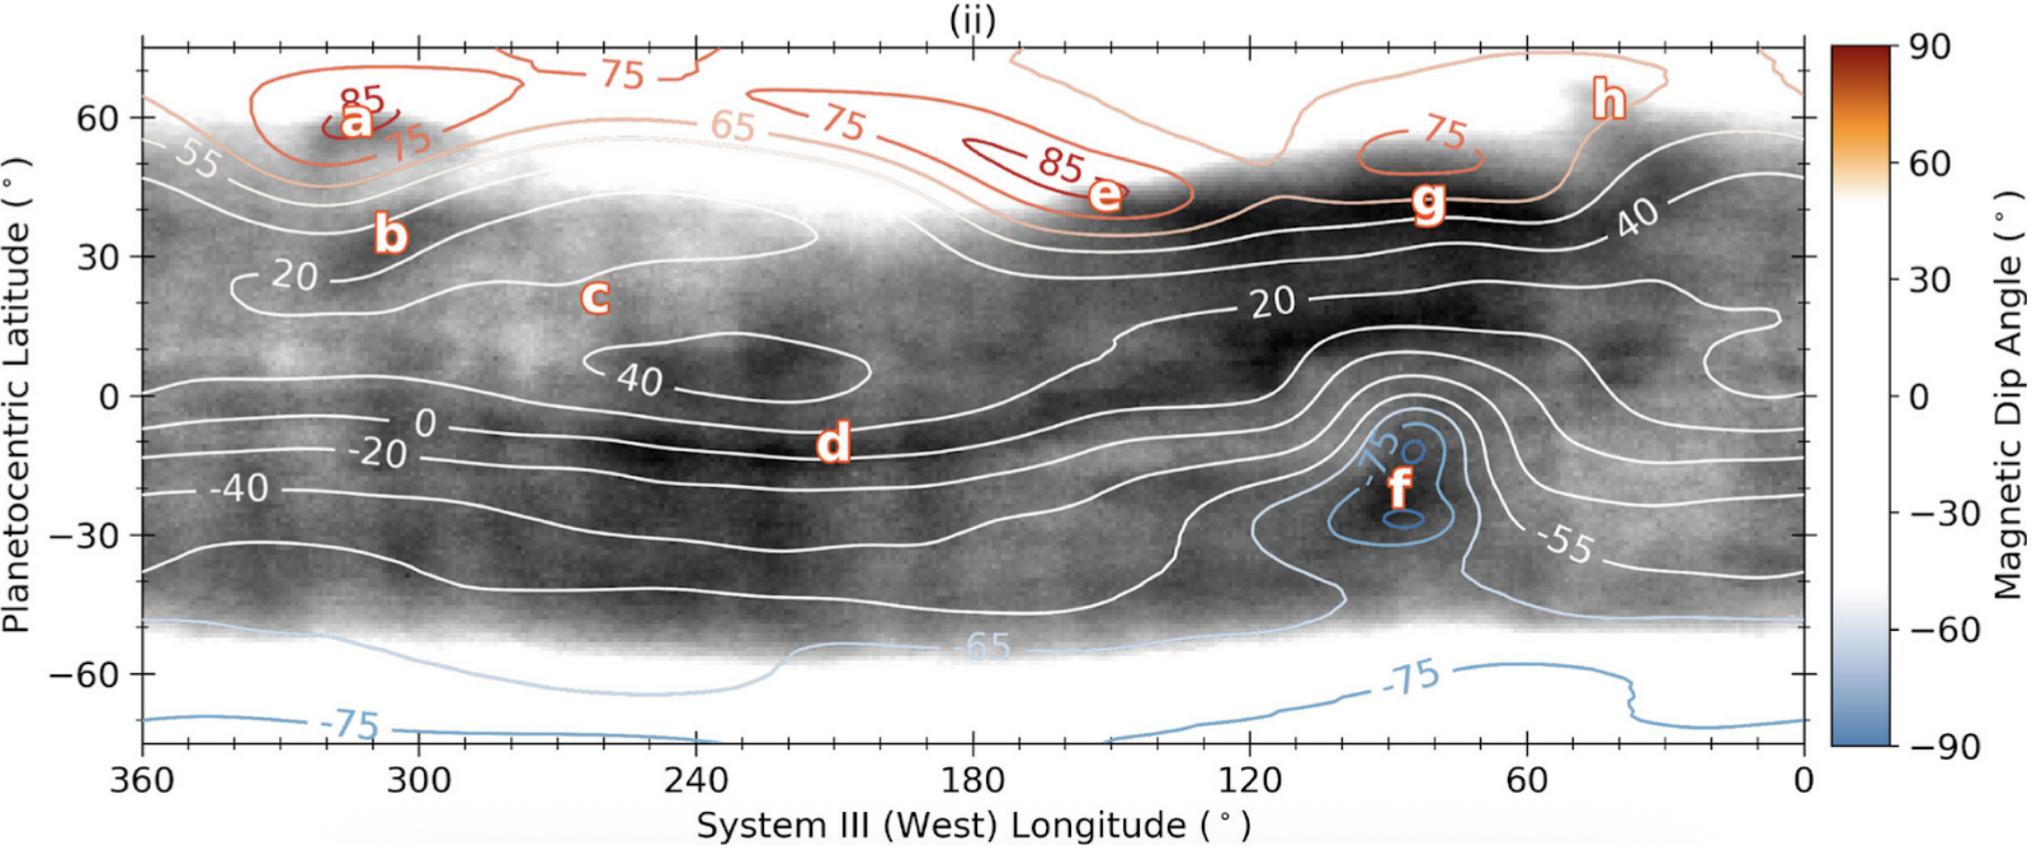
Figure 2ii of Knowles et al, 2025 (https://doi.org/10.1029/2024JE008845) highlighting a range of features identified by the Team. A confident source for all features shown here has now been provided by a combination of modelling and observations from Team members
- The Great Cold Spot. ❄️
- Northern Ionospheric Anomaly. ⁉️
- Broad region of enhancement. 💡
- Dark Ribbon. 🎗️
- Head of the Northern Silhouette. 🗣️
- Southern Ionospheric Dark Spot. ⚫
- Northern Silhouette. AKA THE RAT.🐀
- Tail of the Northern Silhouette. 🐒
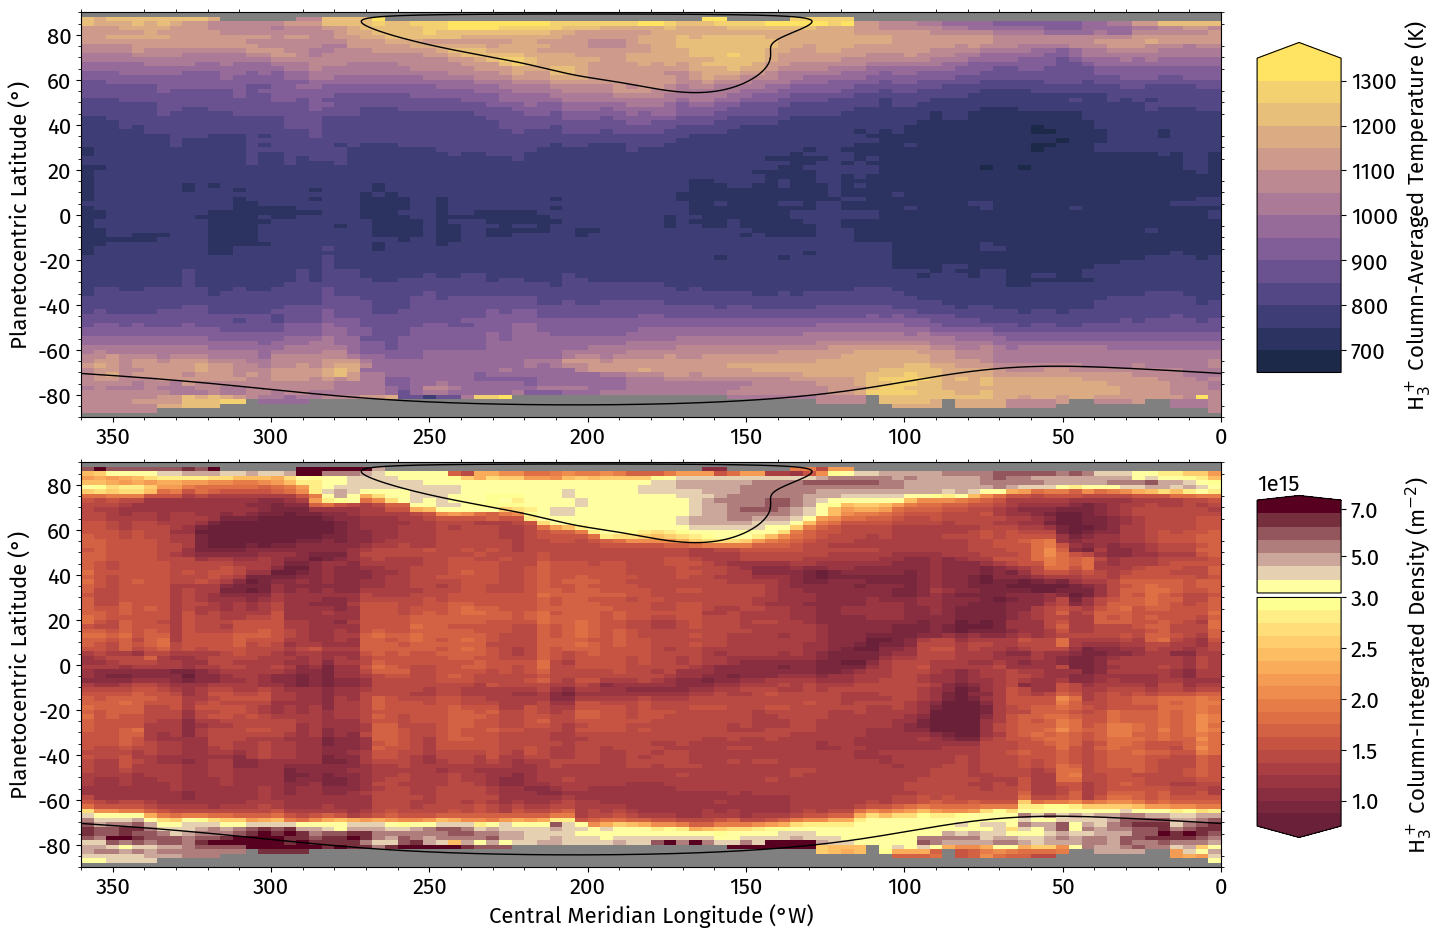
Figure 1 (adapted) of Roberts et al. 2025b (submitted). Top highlights a smooth gradient in temperature from pole to equator, consistent with the global redistribution of auroral energy. Bottom features structures comparable to Knowles et al. 2025a (Stallard et al. 2018), confirming their emission structures are driven by localized density depletions & stable over decades.
Following our first meeting, we undertook a significant body of research, both with analysis of observations and modeling of the ionosphere. Roberts et al. 2025a (https://doi.org/10.3847/PSJ/adc09b) compared the first high resolution maps of upper-atmospheric temperatures to understand the timescales of temperature variability. Knowles et al., 2025a (https://doi.org/10.1029/2025JA033868) highlighted a range of long-term ionospheric features and revealed how closely correlated many of them are to the magnetic field geometry. Roberts et al., 2025b (submitted) revealed clearly that the ionosphere is very stable in temperature over long time spans and these brightness differences are almost entirely due to column density changes (i.e. changes in the ion production or destruction). Additionally, this work emphasized the importance of energy radiance from the nonauroral ionosphere in the global energy budget. In line with this study, Castagnoli et al. (2025a, in preparation) presents distribution maps of H₃⁺ temperature and column density derived from the analysis of JIRAM spectra at auroral latitudes, showing values consistent with those observed from the ground.
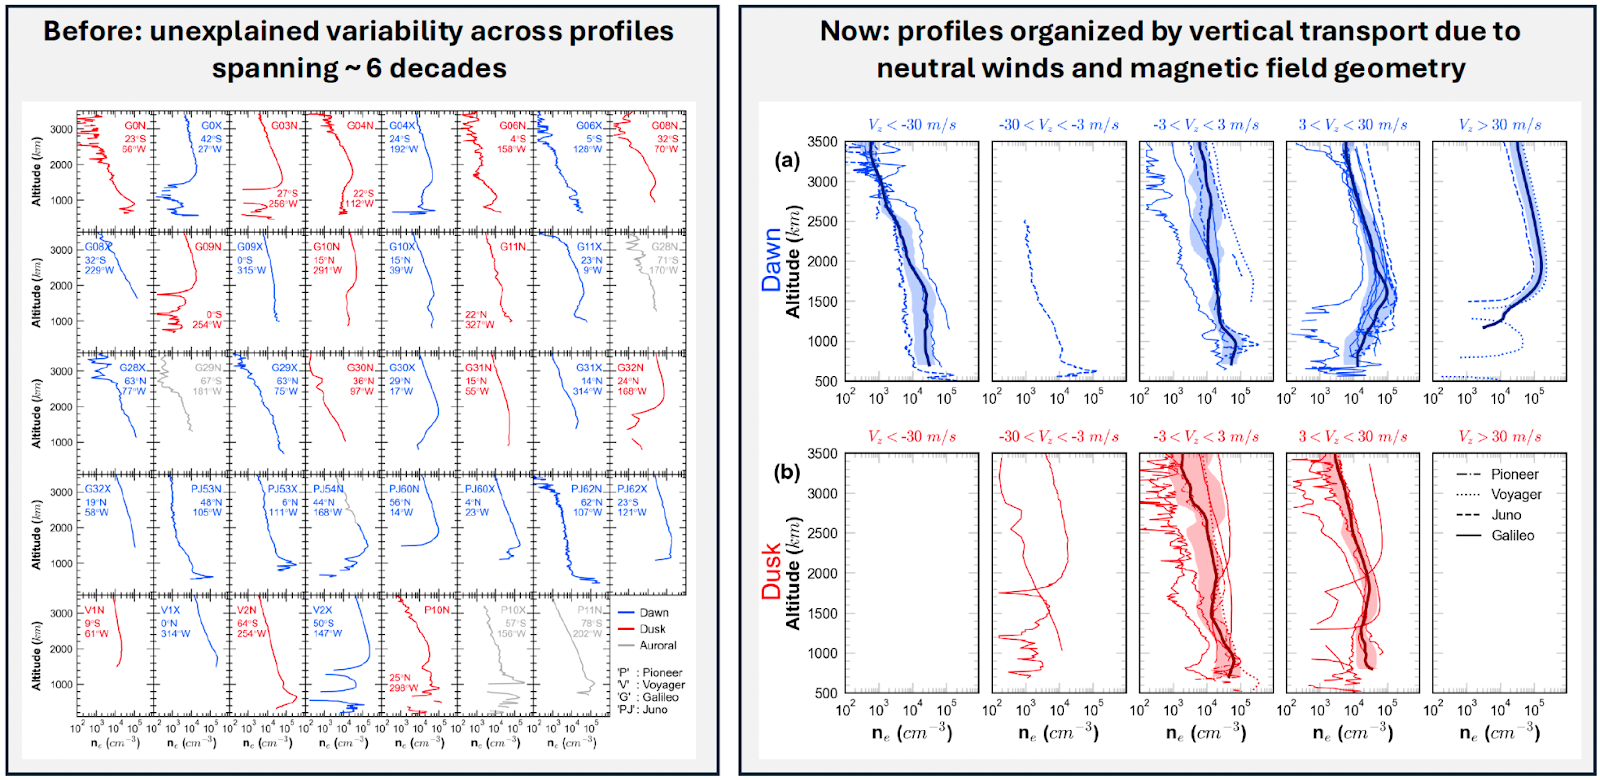
Figures 1 (left) and 5 (right) from Agiwal et al., (2025) showing (left) all published, highly variable, electron density altitude profiles of Jupiter’s upper atmosphere; (right) clear organization of profiles seen when considering neutral wind-driven field-aligned transport. Profiles with low (high) altitude peaks correspond to neutral winds moving plasma down (up) in altitude from simple empirical model predictions.
Agiwal et al., (2025, submitted) took recent modeling of Jupiter’s thermosphere (the Jupiter Thermosphere Ionosphere Model, JTIM; Mueller-Wodarg, 2025) and combined it with the Juno-constrained magnetic field to show that the vertical structure of Jupiter’s ionosphere is primarily governed by neutral winds and magnetic field geometry. In most of the ionosphere, protons and electrons are vertically displaced by neutral winds (also active at Earth and Saturn), reducing the electron density at the H3+ ionospheric peak, resulting in two essential effects. Firstly, the electron density peak moves to higher or lower altitudes, producing changes that match with altitudinal profiles observed over ~6 decades. Secondly, in regions where this happens, the H3+ destruction rate is reduced, enhancing density and thus resulting in brighter emission. In regions where this vertical motion is minimised, the ionosphere is left unaffected (the altitudinally-generalised ionosphere, AGI), and so appear in the maps as regions of darkness. This statistical analysis is complemented by JAMMIES (Mohamed et al. 2025; in prep), a newly developed Jovian ionospheric code coupled with the JTIM. JAMMIES, using the empirically-informed neutral densities and wind patterns from JTIM, is the first Jupiter-specific model to demonstrate how the structures in H3+ (i.e. the dark ribbon) and e- (i.e. radio occultation measurements) naturally follow from neutral-wind driven plasma motion along magnetic field lines and the resultant photochemical effects on the ionosphere.
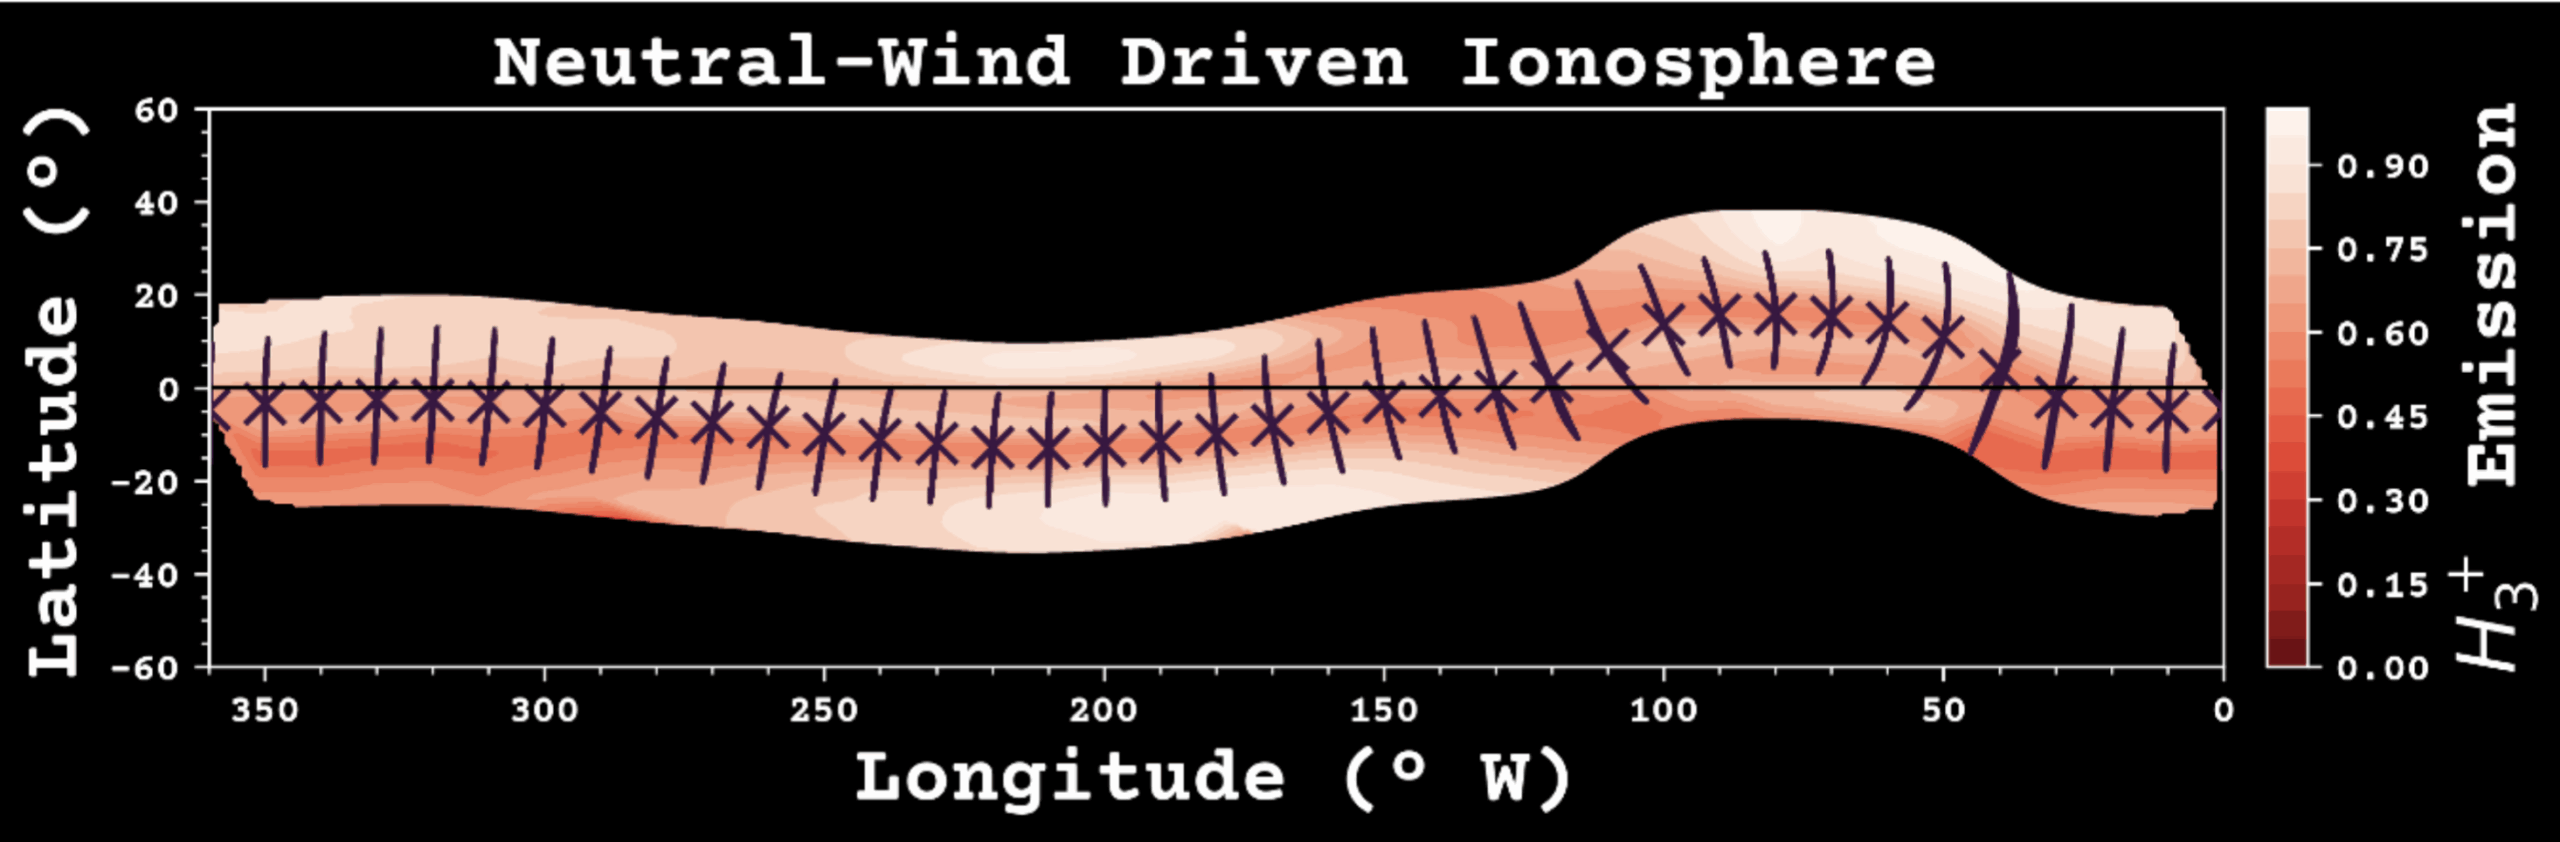
Figure N: JAMMIES (Mohamed et al. 2025, in prep) modeled H3+ emission when neutral winds from JTIM are incorporated, overlaid with the JRM33 degree 13 magnetic equator and field lines every 10º, between 500 and 5000 kilometers altitude. Note how an emission minima naturally arises, flowing the magnetic dip equator longitudinally across the planet.
This effect dominates most of our original H3+ mapped intensities, but one dark region exists away from the regions of predicted AGI, ‘Region B: the Northern Ionospheric Anomaly). However, nightside UV emissions have shown this region has significantly enhanced UV brightness, perhaps indicating active ion precipitation. Though the detailed measurements have not yet been published, one measurement is included in Kurth et al., 2025 (https://doi.org/10.1029/2024JE008845), aligning directly with this region B dark region.
Features B and C were further investigated by calculating Bounce Loss Cones (presented by Domenique Freund at the second meeting) using the JRM33 model and interpreting the results under the first-order assumption that particles drift along a magnetic equator location with constant magnetic field strength. The analysis shows that bright features, such as Feature C, align with regions of higher precipitation probability associated with the opening of the Bounce Loss Cone. In contrast, Feature B (a dark feature mapping to ~1.25-1.75 RJ in the magnetosphere) is located at the boundary where the BLC begins to open, and at this location the footprint of a constant magnetic equator also drops sharply to very low latitudes. This combination suggests that precipitation may provide an explanation for this feature. Future work will therefore examine exact particle trajectories by conserving all invariants and determining which populations are precipitating. Nonetheless, this provides a strong initial indication that precipitation is likely to be a key driving factor for those Features.
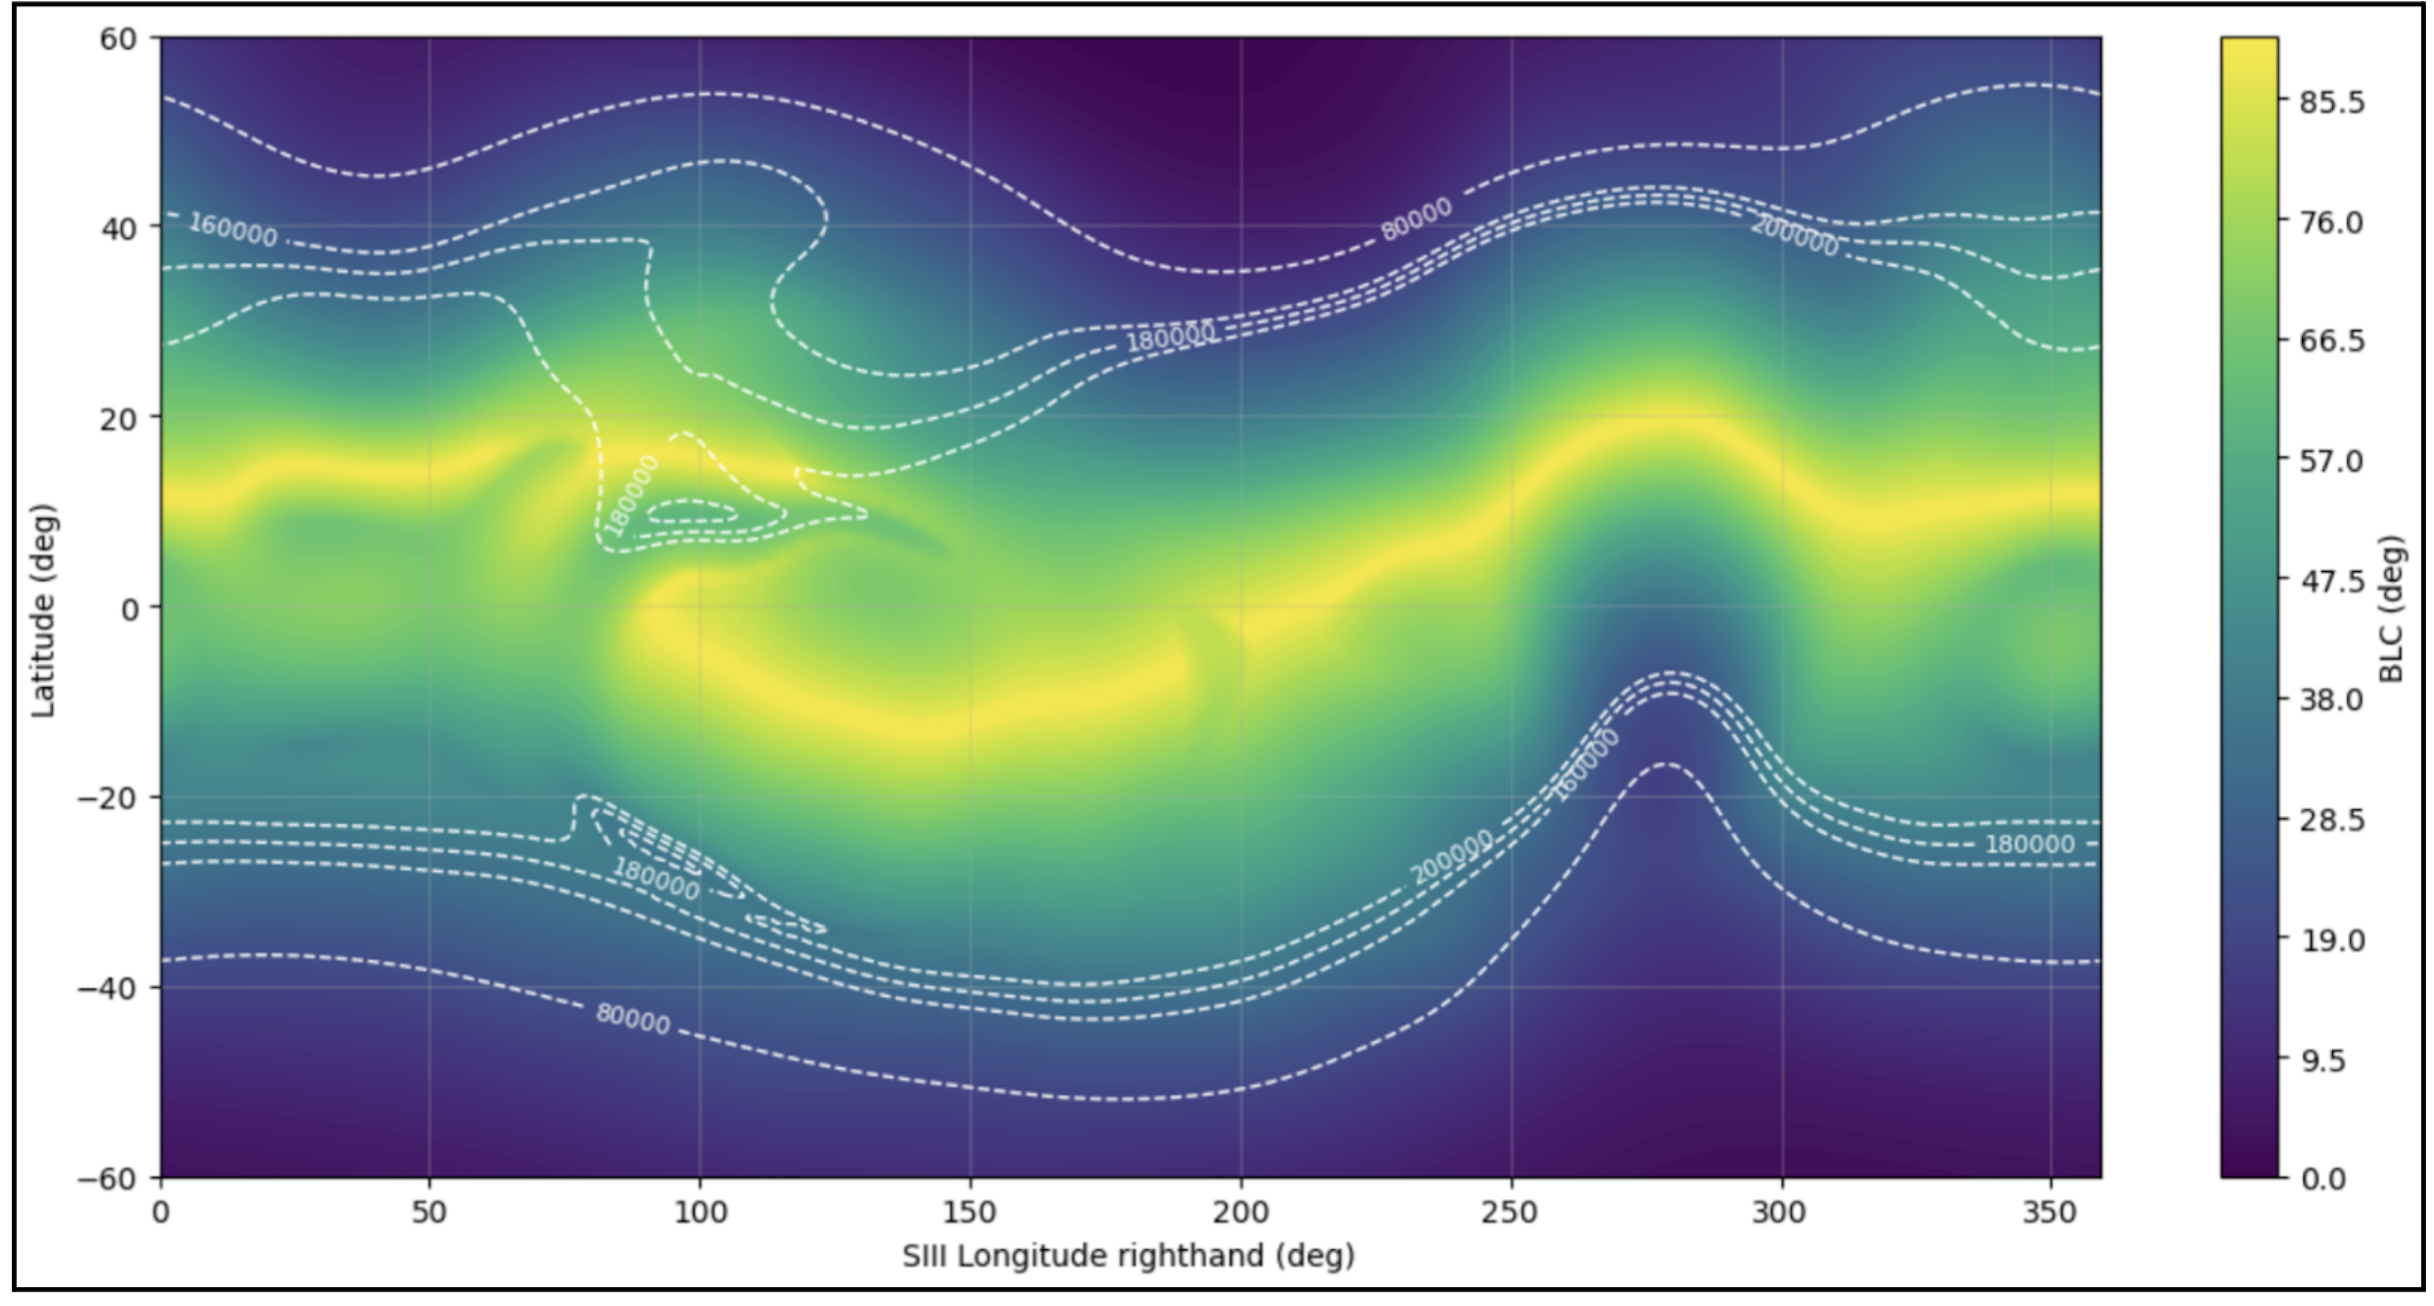
Figure showing the regions of highest pitch angle infall for drifting particles, with ions drifting along the white lines from left to right, many particles with moderate pitch angles will be deposited in the atmosphere where the minimum pitch angle is higher in the region of 30-40N and 50-100E.
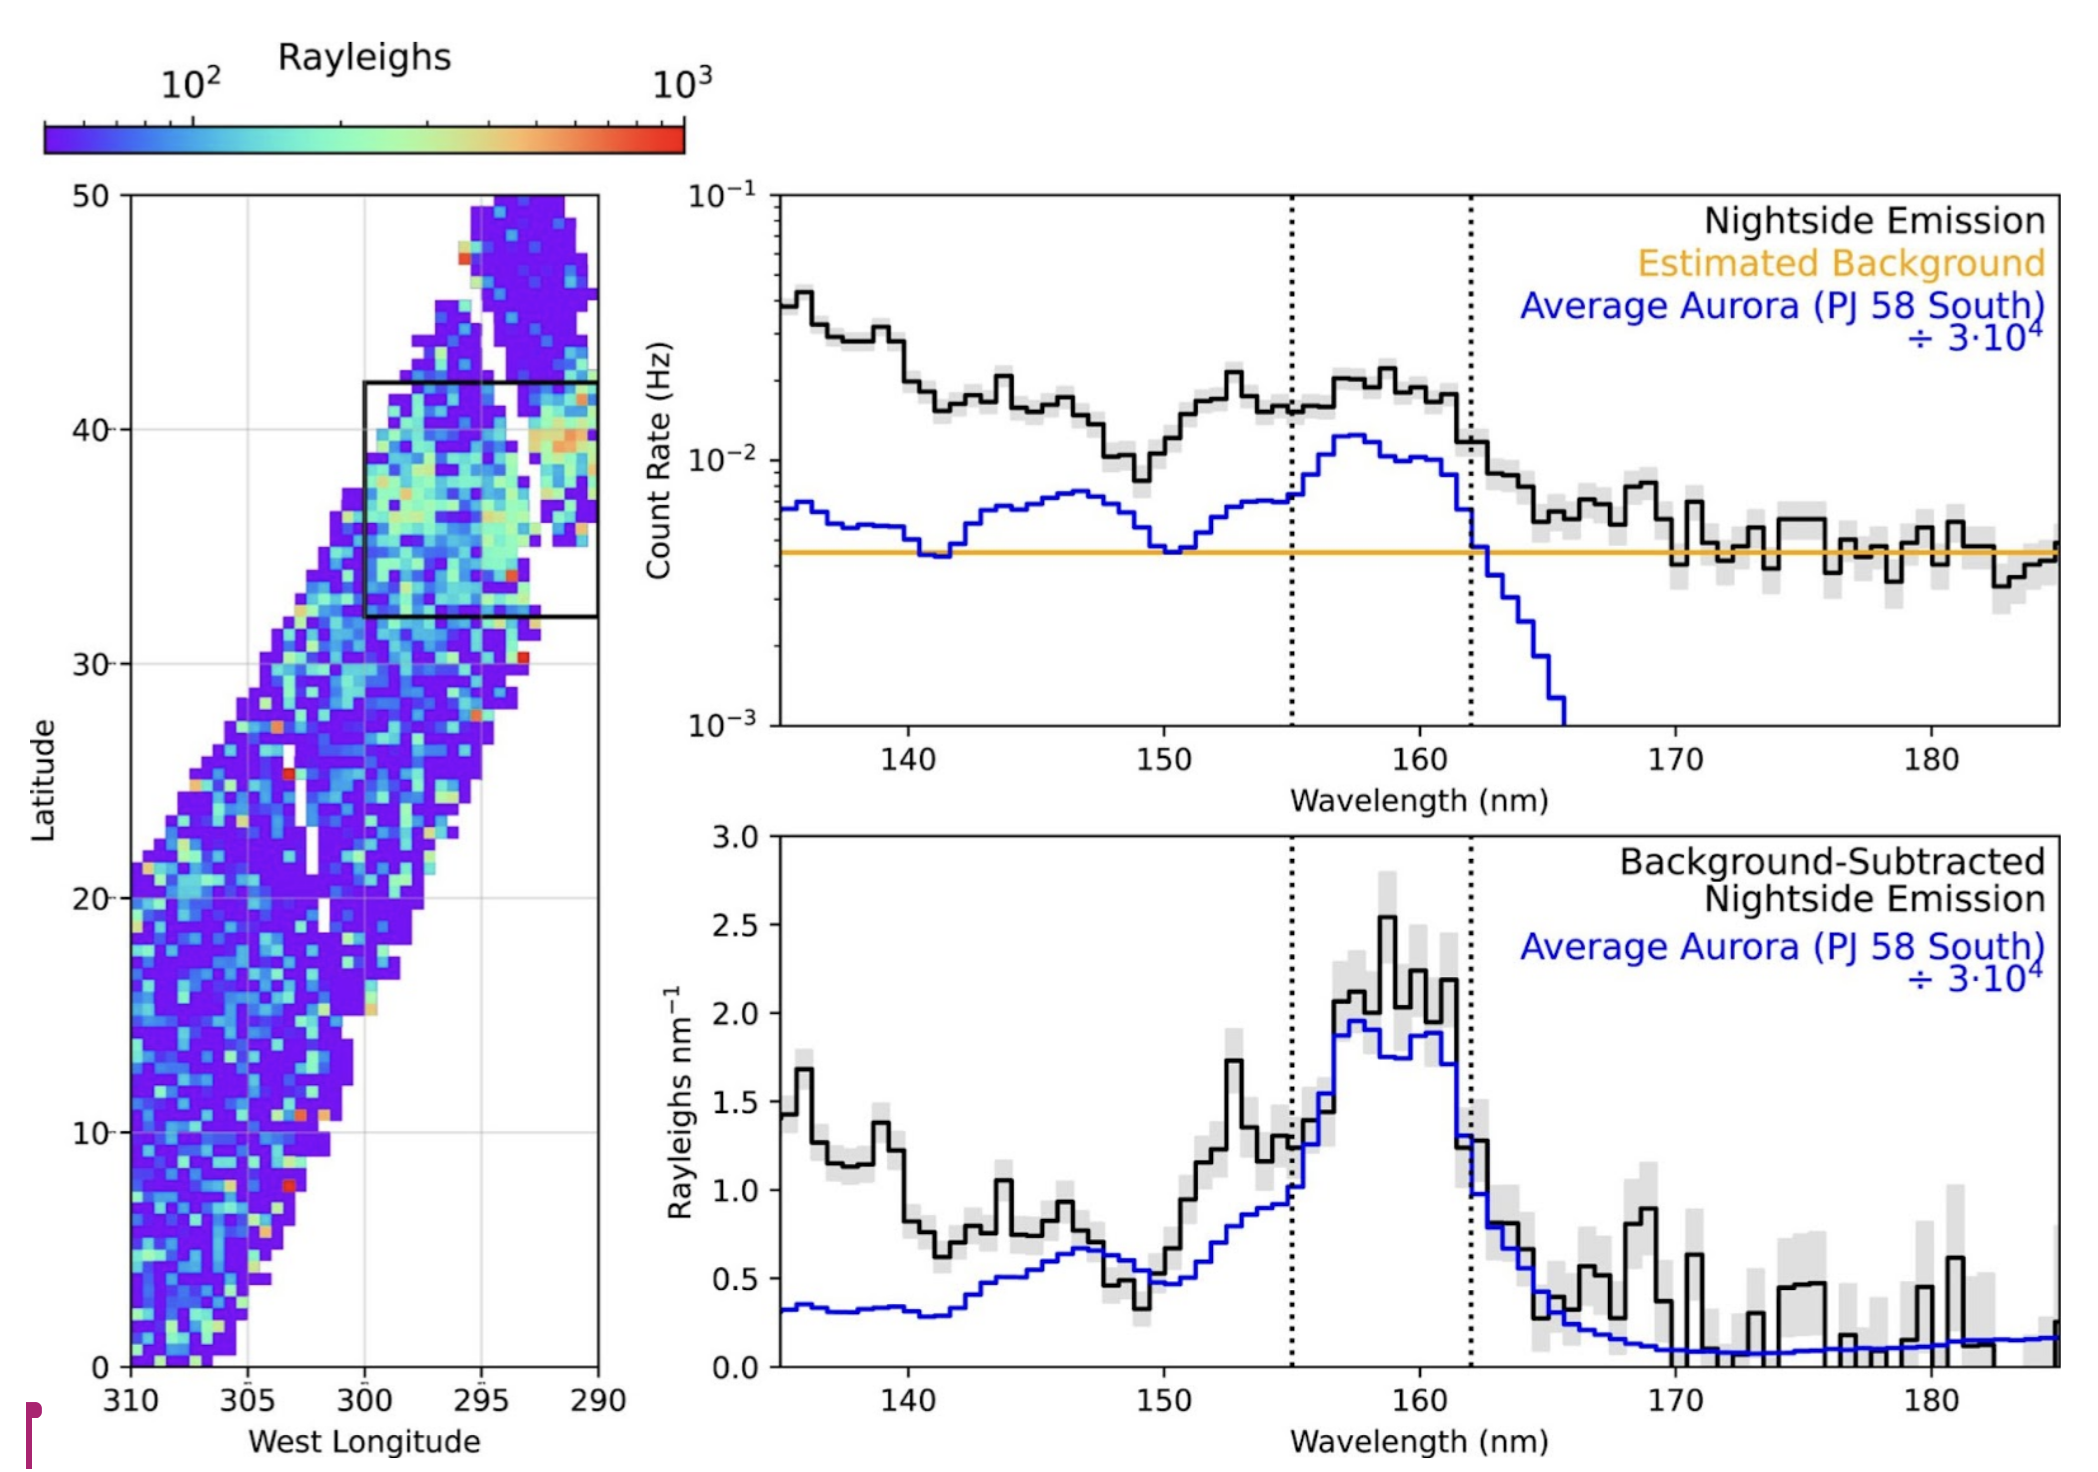
Figure 20 from Kurth et al., (2025 https://doi.org/10.1029/2024JE008845), highlighting ongoing observations of the UV nightside emission associated with infalling precipitation close to Region B of the ionosphere. Further observations were not shown but described at the meeting, as further highlighting regions of magnetospheric ion drift.
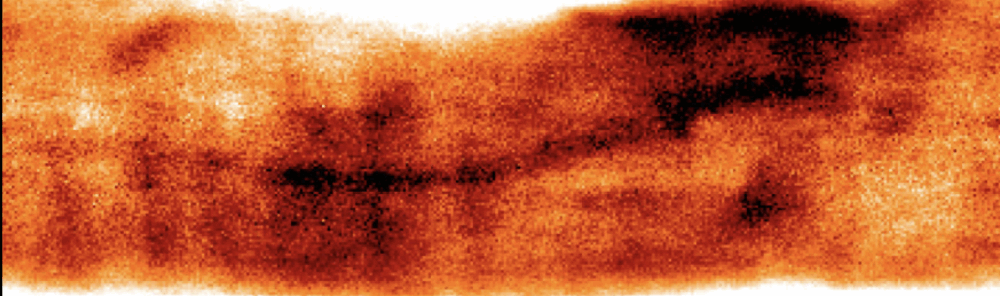
At the smallest scales explored, JWST observations around Jupiter’s entire limb show the presence of ubiquitous small-scale ionospheric irregularities across the mid-to-low latitudes (Knowles et al, 2025c; in prep), where the local ionospheric density structure is continuously altered. DEVIL IN THE DETAILS 👹 (c Khalid Mohamed, 2025)
The Team’s research and discussions extended even up to the sub-auroral latitudes. The auroral footprints of Jupiter’s Galilean moons have been measured previously, but only in emission. Knowles et al., (2025b, submitted) presents the first near-infrared spectral measurements of the auroral footprints of Io and Europa from JWST/NIRSpec IFU observations, and identifies never-seen-before variability across the Io footprint that is likely linked to extreme changes in the incident precipitating population. Castagnoli et al. (2025b, in preparation) presents an analysis of JIRAM NIR spectra sampling the MAW, TEB, and RAW spots on Io and Ganymede. The results show that the H₃⁺ temperatures and column densities in the MAW and RAW are comparable to those retrieved in the main auroral oval with JIRAM, whereas the TEB spots display a distinct behaviour. Additionally, JIRAM limb observations presented in Migliorini et al. (2023) provided high spatial resolution spectra showing detached H₃⁺ and CH4 layers over the disc of the planet that enabled the initial development of retrieval tools for non-LTE radiative transfer of stratospheric methane. These tools are currently being refined and will be used to derive the vertical distribution of CH4 at equatorial latitudes, with the potential for application at auroral latitudes.
Other significant advances presented at the meeting:
– Coffin et al., (2025) presented the first set of Jupiter vertical electron density profiles from the Juno mission.
– Kurth et al., (2025) presented electron densities derived from the Juno Waves instrument that appeared to be correlated in system iii longitude, with the lowest densities corresponding to longitudes with highly unusual magnetic field structure.
Papers:
Knowles et al., 2025a, https://doi.org/10.1029/2025JA033868
Kurth et al., 2025 https://doi.org/10.1029/2024JE008845
Roberts et al. 2025a, https://doi.org/10.3847/PSJ/adc09b;
Tiranti et al. 2025, https://doi.org/10.1029/2025JA034066
With more to come.